
Measuring What Matters: A Rigorous Guide to KPIs and Benchmarks for Post-Merger Integration Success
The moment the champagne corks pop on deal close, a clock starts ticking. That clock does not measure legal deadlines or regulatory windows. It measures something far more consequential: whether the strategic thesis that justified the acquisition will ever translate into tangible value. Study after study places M&A failure rates somewhere between 50 and 70 percent, and the overwhelming majority of those failures trace not to flawed deal logic but to flawed execution during post-merger integration (PMI). Yet despite the stakes, many integration teams operate with surprisingly blunt instruments when it comes to tracking whether their efforts are working.
Measuring PMI success is not an academic exercise. It is the primary mechanism through which leadership teams maintain accountability, detect problems early enough to correct them, and ultimately determine whether an acquisition created or destroyed shareholder value. Without disciplined measurement, integration becomes a series of well-intentioned activities disconnected from outcomes. With it, integration becomes a managed process with feedback loops that drive adaptation and learning.
This article offers a comprehensive framework for how seasoned M&A practitioners can measure post-merger integration success with rigor and nuance. It covers the core themes and terminology that underpin integration measurement, identifies three key answers to the measurement challenge, and examines three real-world cases where companies applied these principles in practice. The goal is practical: to help integration leaders select the right KPIs, calibrate realistic benchmarks, and tailor their measurement approach to the specific context of each deal.
Core Themes, Current Trends, and Foundational Concepts
Why Measure Integration Success at All?
The rationale for measuring PMI success extends well beyond satisfying the board’s curiosity about whether the deal was “worth it.” Rigorous measurement serves four distinct purposes. First, it creates accountability by linking integration workstreams to specific outcomes that individuals and teams own. Second, it enables early intervention by surfacing leading indicators of trouble before lagging financial results confirm the damage. Third, it supports organizational learning by building an institutional memory of what works across multiple deals, which is especially valuable for serial acquirers. Fourth, it protects the credibility of the M&A function itself, because a track record of measured, demonstrable value creation makes the next deal easier to justify to skeptical stakeholders.
The cost of not measuring is equally instructive. When integration proceeds without clear metrics, leadership teams tend to declare victory based on the completion of activity milestones—systems migrated, org charts published, branding unified—without ever verifying whether those activities produced the synergies, customer retention, or capability gains that justified the premium.
What Are KPIs in the Context of PMI?
A Key Performance Indicator, or KPI, is a quantifiable measure that an organization uses to evaluate its performance against a defined objective. In PMI, KPIs serve as the connective tissue between the deal thesis and the integration plan. They answer a deceptively simple question: how will we know this is working?
Effective PMI KPIs share several characteristics. They are directly linked to the value drivers articulated in the deal thesis. They are measurable with data that both legacy organizations can reliably produce. They have a defined owner and a defined cadence of reporting. And they distinguish between leading indicators (which predict future performance) and lagging indicators (which confirm past results). An integration that tracks only lagging indicators is essentially driving by looking in the rearview mirror.
Beyond KPIs: Other Methods of Measuring Success
KPIs are necessary but not sufficient. Quantitative metrics can miss critical dimensions of integration health. Three complementary measurement approaches deserve attention:
Pulse surveys capture employee sentiment, cultural alignment, and engagement at regular intervals. They provide early warning signals that spreadsheets cannot, because a workforce that is confused, demoralized, or actively resistant will eventually show up in your financial KPIs—just too late to do much about it.
Qualitative milestone assessments evaluate the completion and quality of integration workstreams through structured reviews. Did the combined sales force complete cross-training? Is the integrated supply chain operating under a single planning process? These assessments add texture to the numbers.
Customer health tracking uses Net Promoter Scores, retention analytics, churn rates, and direct customer feedback to determine whether the integration is creating value or friction for the people who ultimately pay the bills.
Current Trends in PMI Measurement
Several trends are reshaping how sophisticated acquirers approach integration measurement. The rise of integration management offices (IMOs) as standing functions within serial acquirers has professionalized the discipline and created demand for standardized measurement frameworks that work across deals. Real-time dashboards, powered by increasingly capable data integration tools, have compressed reporting cycles from monthly to weekly or even daily for critical KPIs. There is also growing recognition that cultural integration metrics—historically dismissed as “soft”—are among the strongest predictors of long-term deal success. Finally, ESG considerations have introduced entirely new measurement dimensions, as acquirers face pressure to demonstrate that transactions do not degrade the combined entity’s sustainability performance.
Three Key Answers to the PMI Measurement Challenge
Key Answer 1: Anchor Your KPIs to the Deal Thesis, Not to Generic Templates
The single most important principle in PMI measurement is that your KPIs must flow directly from the specific strategic rationale for the deal. A cost synergy–driven acquisition demands different metrics than a revenue synergy play, a capability acquisition, or a geographic expansion. Generic PMI scorecards that treat every deal identically are a reliable path to measuring the wrong things precisely.
How to apply this principle: Start by deconstructing the deal thesis into its component value drivers. If the thesis rests on $80 million in cost synergies through procurement consolidation and headcount optimization, your primary KPIs should track realized procurement savings by category, headcount reduction against plan, and the timeline of synergy capture relative to the integration budget. If the thesis depends on cross-selling the acquirer’s products into the target’s customer base, your primary KPIs should track cross-sell pipeline generation, conversion rates, and incremental revenue per customer.
This principle also applies to what you choose not to measure. Integration teams that try to track everything end up overwhelmed by data and unable to prioritize. A disciplined approach selects 10 to 15 primary KPIs tied to value drivers and supplements them with a broader set of operational metrics that functional leaders monitor independently.
How to set reasonable targets: The deal model itself provides the starting benchmark for financial KPIs, but experienced practitioners know to discount it. Deal models are built under competitive pressure to win the auction, and they tend to embed optimistic assumptions about synergy timing and magnitude. A useful heuristic is to plan for 70 to 80 percent of modeled synergies to materialize, with a 6- to 12-month delay relative to the original timeline. Industry-specific benchmarks can refine these estimates further. Technology acquisitions, for example, typically achieve revenue synergies more slowly than industrial combinations achieve cost synergies, because cross-selling requires product integration work that is difficult to accelerate.
Key Answer 2: Measure Across Three Horizons—Financial, Operational, and Human
The second key answer addresses what categories of KPIs to track. Effective PMI measurement spans three distinct horizons that operate on different timescales and capture different dimensions of integration health:
Financial KPIs are the ultimate arbiter of deal success, but they are predominantly lagging indicators. They include revenue growth relative to standalone projections, EBITDA margin improvement, realized synergies (both cost and revenue), return on invested capital (ROIC) relative to the cost of capital, and earnings per share accretion. Financial KPIs typically require 18 to 36 months to reflect integration outcomes fully.
Operational KPIs function as the leading indicators that predict financial results. They vary significantly by function:
- Sales and commercial: pipeline velocity, win rates, customer retention rates, cross-sell attach rates, and average deal size in the combined entity.
- Operations and supply chain: capacity utilization, order-to-delivery cycle time, supplier consolidation progress, and inventory turnover.
- Technology and IT: system migration completion, application rationalization, cybersecurity incident rates during transition, and user adoption metrics for unified platforms.
- Finance: close cycle time for consolidated reporting, working capital optimization, and integration budget variance.
- Legal and compliance: regulatory approval timelines, contract novation progress, and outstanding litigation exposure.
Human and cultural KPIs are the most frequently underweighted and arguably the most predictive of long-term outcomes. They include voluntary attrition rates for identified key talent, employee engagement scores (measured through pulse surveys at 30, 60, 90, and 180 days), time to fill open roles in the combined organization, internal mobility rates, and participation in cross-legacy team activities. Research consistently shows that deals where key talent attrition exceeds 15 percent in the first year underperform their integration targets by a significant margin.
Industry and maturity considerations: The relative weighting of these three horizons shifts depending on context. In pharmaceuticals, where the target’s value often resides in a pipeline of compounds and the scientists who develop them, human and cultural KPIs may matter more than immediate financial metrics. In consumer packaged goods, where the integration thesis typically centers on distribution synergies and SKU rationalization, operational KPIs dominate. For acquisitions involving early-stage companies, traditional financial KPIs like EBITDA improvement may be irrelevant for years; instead, product development milestones, user growth, and technology integration metrics take priority.
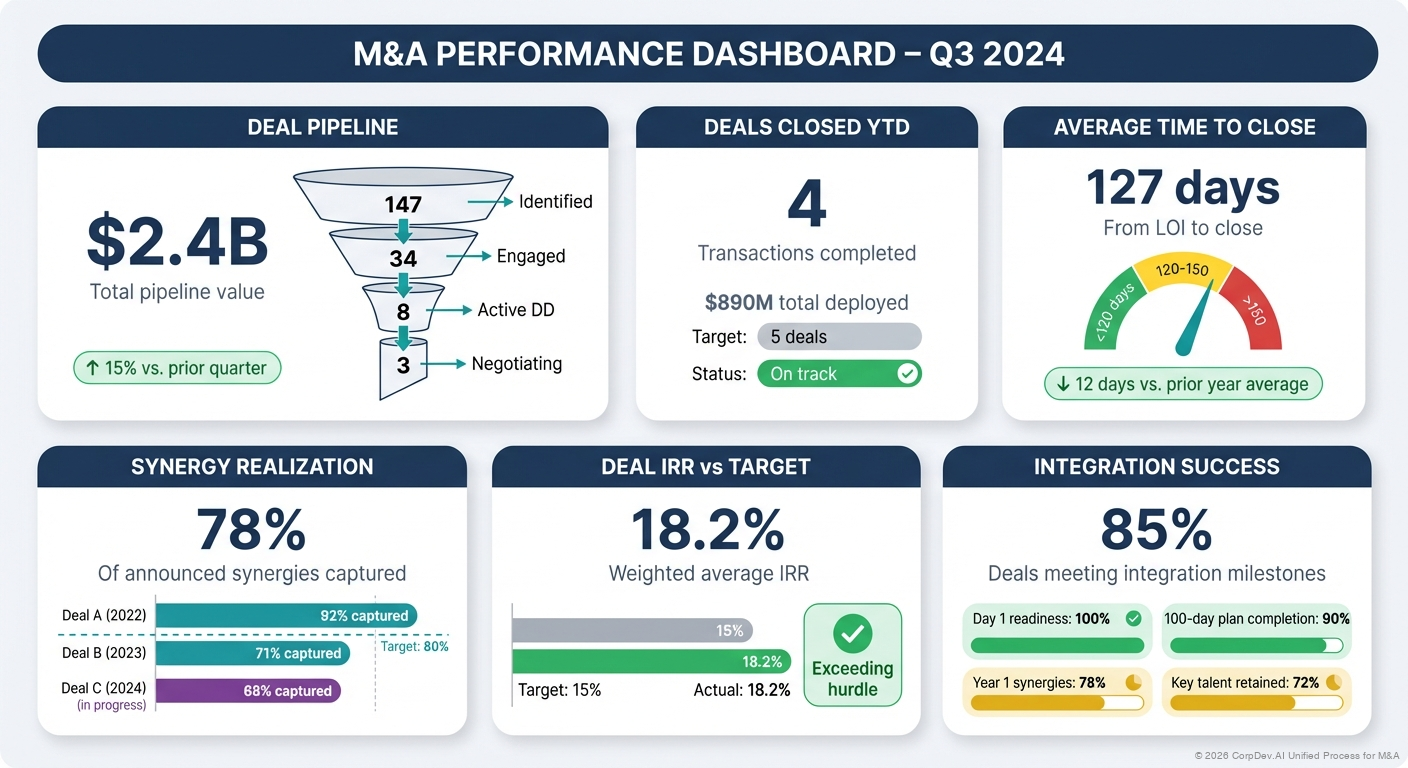
An M&A performance dashboard tracking deal pipeline, synergy realization, and integration milestones—illustrating how serial acquirers use structured KPIs across financial, operational, and human dimensions to measure post-merger integration success in real time.
Key Answer 3: Benchmark Rigorously but Contextually
The third key answer addresses the question that every integration leader eventually confronts: how do we know what “good” looks like?
Benchmarks provide the external reference points that prevent integration teams from grading their own homework. They come from three sources:
Industry benchmarks are published by consulting firms, advisory practices, and academic researchers. They offer useful general guidance: for example, that industrial combinations typically capture 60 to 80 percent of identified cost synergies within two years, or that technology acquisitions retain less than 50 percent of the target’s senior engineering talent after 18 months if retention programs are not implemented early. These benchmarks are valuable as starting points but dangerous as rigid standards, because they flatten enormous contextual variation into single numbers.
Internal benchmarks are available to serial acquirers who track performance across their own deal portfolio. These are far more useful because they control for the acquiring organization’s own integration capabilities, culture, and operating model. A company that has completed 15 acquisitions over a decade can identify its own historical patterns—average time to achieve synergy run rate, typical first-year attrition rates, standard integration cost as a percentage of deal value—and use them to set expectations for the next deal with much greater confidence than generic industry data permits.
Deal-specific benchmarks are derived from the target’s pre-acquisition performance and the combined entity’s pre-close projections. They answer the counterfactual question: what would have happened without the deal? This is the most analytically demanding form of benchmarking, because it requires constructing a credible standalone scenario for both organizations and measuring integration outcomes against it rather than against arbitrary targets.
Calibrating targets: The most sophisticated integration teams use a tiered target structure. A “base case” target represents the minimum acceptable outcome, typically aligned with the synergies committed to in the board approval. A “management case” target represents the expected outcome under the integration plan as designed. An “upside case” captures additional value that could materialize if integration proceeds faster or more smoothly than planned. This tiered approach prevents the binary thinking—success or failure—that plagues many integration assessments and replaces it with a more nuanced evaluation of performance relative to realistic expectations.
Three Real-World Cases in Practice
Case 1: Illinois Tool Works and the Discipline of Thesis-Anchored Measurement
Illinois Tool Works (ITW) does not generate the same headline attention as mega-mergers, but its acquisition strategy offers one of the clearest illustrations of KPI discipline anchored to a deal thesis. Over decades, ITW built a diversified industrial portfolio through hundreds of acquisitions, most of them small- to mid-cap targets in fragmented manufacturing niches. The deal thesis for these acquisitions was remarkably consistent: acquire businesses with defensible market positions and then apply ITW’s 80/20 front-to-back operating methodology to simplify product lines, focus resources on the highest-margin customer segments, and improve operating margins.
Because the thesis was so explicit, ITW’s integration KPIs followed a clear hierarchy. The primary metric was operating margin improvement in the acquired business, benchmarked against the margin trajectory that the 80/20 process had delivered in comparable past acquisitions. Secondary KPIs tracked product line simplification (measured by SKU reduction), customer concentration shifts (revenue share from the top 20 percent of customers), and working capital efficiency. Human capital metrics focused narrowly on retaining the operational leaders who understood the acquired business’s customer relationships, rather than attempting broad-based cultural integration surveys that would have been disconnected from the thesis.
What makes ITW instructive is the rigor of the feedback loop. The company tracked margin improvement curves across its acquisition portfolio and used that proprietary dataset to set integration timelines and targets for each new deal. When an acquired business deviated from the expected margin trajectory at the six-month mark, the IMO intervened with additional 80/20 coaching and resources. When a business tracked ahead of plan, ITW studied why and incorporated the learnings into its playbook. This is thesis-anchored measurement functioning as a genuine management system rather than a reporting exercise.
Case 2: Pernod Ricard’s Acquisition of Allied Domecq — Measuring Across All Three Horizons
When French spirits group Pernod Ricard acquired Allied Domecq in 2005 for approximately €10.7 billion, the deal represented a transformative bet. The acquisition nearly doubled Pernod Ricard’s size and gave it a global distribution network capable of competing with industry leader Diageo. The complexity of the integration was substantial: it involved divesting certain brands to satisfy regulatory requirements (with Fortune Brands acquiring several bourbon labels), rationalizing overlapping distribution networks across dozens of markets, and blending two corporate cultures with very different geographic orientations.
Pernod Ricard’s integration team structured its measurement framework across all three horizons with unusual deliberateness. Financial KPIs tracked the expected cost synergies from distribution network consolidation, which the company had publicly committed to at €300 million, along with organic revenue growth rates for the priority brand portfolio post-integration. Operational KPIs measured distribution reach in key growth markets—particularly India, China, and travel retail—where the combined network was supposed to unlock access that neither company possessed independently. The commercial team tracked rate of distribution point expansion and time-to-shelf for priority brands entering new markets through the combined network.
On the human and cultural dimension, Pernod Ricard made a deliberate decision that many acquirers avoid: it retained a significant proportion of Allied Domecq’s regional management teams, recognizing that local market knowledge in spirits distribution is extraordinarily difficult to replace. The company tracked retention of these identified leaders and measured cultural integration through its existing employee engagement framework, extending pulse surveys to the acquired workforce within 60 days of close. The results were notable. Pernod Ricard exceeded its synergy commitment ahead of schedule and, critically, accelerated brand growth in the Asian markets that were central to the long-term thesis. The multi-horizon measurement approach allowed leadership to distinguish between synergy milestones that were on track and market penetration KPIs that required additional investment, avoiding the trap of letting strong cost performance mask slower progress on the revenue growth drivers that would ultimately matter more.
Case 3: Danaher — The Serial Acquirer’s Benchmarking Advantage
Danaher Corporation has completed more than 400 acquisitions over several decades, making it one of the most studied serial acquirers in the world. Its approach to PMI measurement illustrates the power of internal benchmarking at scale. Danaher’s integration methodology, embedded in the Danaher Business System (DBS), provides a standardized but adaptable framework for measuring integration progress and outcomes across every deal.
Each acquisition enters a structured integration process where KPIs are selected from a well-defined menu and calibrated against Danaher’s historical performance on similar deals. The company tracks operational metrics—such as on-time delivery, inventory turns, and gross margin improvement—with a discipline that reflects its lean manufacturing heritage. Crucially, Danaher measures the speed and depth of DBS adoption within acquired businesses as a leading indicator of long-term performance, on the empirical basis that businesses which fully adopt DBS tools consistently outperform those that resist them.
The internal benchmarking advantage is significant. When Danaher acquires a $500 million industrial business, it does not rely on generic industry synergy benchmarks. It draws on its own data from dozens of comparable transactions to set targets for margin improvement timelines, working capital optimization, and talent integration. This proprietary dataset gives Danaher an informational edge that compounds with each successive deal, creating a virtuous cycle where better measurement enables better integration, which generates better data for the next acquisition. The lesson for other acquirers is clear: invest in building your own benchmark library, because generic data will never match the predictive power of your own experience.
Setting Functional KPIs: A Practical Reference
Different functions within the combined organization require distinct metrics that reflect their specific contribution to integration success. While the preceding sections addressed this theme broadly, a brief functional reference may help practitioners designing their integration scorecards:
Human Resources should track regretted attrition rates segmented by performance tier, time to harmonize compensation and benefits, leadership role fill rates, and cultural integration survey scores.
Finance should measure synergy realization against plan (tracked monthly), integration cost budget variance, days to consolidated financial close, and working capital as a percentage of revenue.
Commercial and Sales should monitor customer retention by segment, revenue run rate versus standalone projections, sales force productivity during transition, and cross-sell pipeline development.
IT and Technology should track system migration milestones, unplanned downtime during transitions, cybersecurity posture metrics, and end-user satisfaction with integrated platforms.
Operations should measure capacity utilization trends, supplier consolidation milestones, quality incident rates during transition, and logistics cost per unit.
Each of these functional scorecards should roll up into the enterprise-level integration dashboard while maintaining enough granularity to be actionable at the functional level. The integration management office bears responsibility for ensuring consistency across functions and resolving conflicts where functional KPIs may work at cross-purposes—for instance, where aggressive headcount reduction targets in one function threaten talent retention goals in another.
Conclusion
Measuring post-merger integration success is both a science and a craft. The science lies in selecting the right KPIs, collecting reliable data, and applying benchmarks with analytical rigor. The craft lies in knowing which metrics matter most for a given deal, resisting the gravitational pull toward measuring only what is convenient, and interpreting results with the contextual judgment that no dashboard can automate.
Three principles anchor effective PMI measurement. First, every KPI must trace directly to the deal thesis, because metrics that are disconnected from strategic intent generate activity without accountability. Second, measurement must span financial, operational, and human dimensions, because deals that optimize one dimension while neglecting others routinely destroy the value they set out to create. Third, benchmarks must be applied with contextual intelligence, drawing on industry data, internal track records, and deal-specific baselines rather than treating any single reference point as definitive.
The companies that measure integration well share a common trait: they treat measurement not as a reporting obligation but as a management tool. Their dashboards do not merely document what happened. They drive decisions about what should happen next. In a discipline where the margin between value creation and value destruction is often razor-thin, that distinction matters enormously.
As you prepare for your next integration, consider this question: if you could track only five KPIs across the entire integration, which five would you choose, and what does that choice reveal about the true logic of your deal?

Leave a comment